The graph below shows the percentage of people visiting the gym once a month or more between 1984 and 2003.
Summarise the information by selecting and reporting the main features, and make comparisons where relevant.
Write at least 150 words.
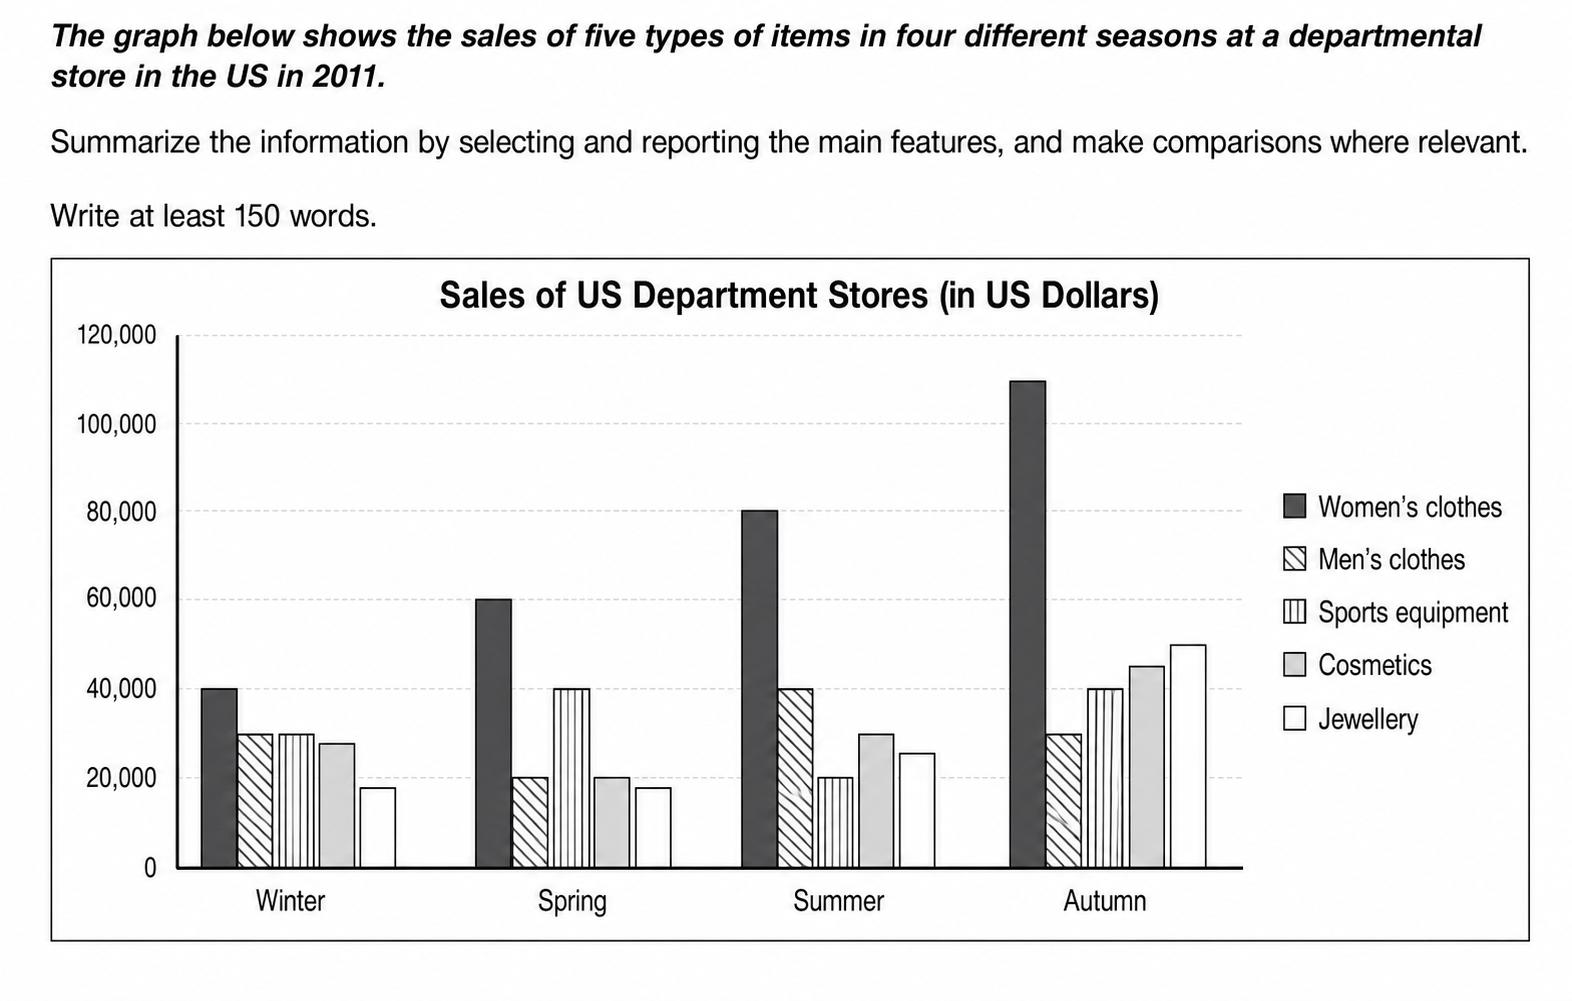
The graph below shows the percentage of people visiting the gym once a month or more between 1984 and 2003.
Summarise the information by selecting and reporting the main features, and make comparisons where relevant.
Write at least 150 words.
Please log in or create an account to access this mock test, track your answers, and receive your verified IELTS Band Score.